Time for an earnings update.
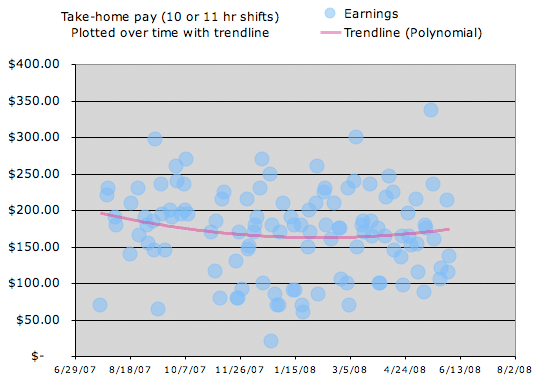
My earnings floor — the lowest take-home pay I can expect — is increasing from the record lows of the winter. In other words, it’s rare this time of year to see a shift that doesn’t net me at least $100. In the winter I had sub $100 shifts much more often.
The ceiling seems to hover around $250, with occasional exceptions like Bay to Breakers Sunday — the most recent high outlier on the chart.
Unfortunately, earnings don’t ‘feel’ as high as they did last summer. Indeed, recent earnings seem clustered around $150, compared to a large cluster around $200 last summer. Two obvious reasons: gate fee increase and fuel cost increases, both costs are borne directly by cab drivers. Other potential reasons: tourist activity has yet to reach peak, major SF events and street fairs happen later in summer, I work less lucrative shifts than last summer.
For fun, here is a chart of gas prices over the past year. The red line is San Francisco, the blue is USA average.
My take-home shift average still hovers around $170.10* since I started driving July 2007. My median take-home pay (the middle amount of all shifts worked) is $176.
When I started last summer it was at the peak of the high earnings season. Plus, I worked the rather lucrative Saturday and Sunday day shifts (when compared to lower earning Monday and Tuesday shifts I added). I thought these seasonal and day of the week changes would give an artificially inflated view of my earnings, so I also computed take-home average for 2008 only, which starts at the low-point of the season and includes the lower earning Monday and Tuesdays.
I guessed the 2008 year-to-date (YTD) average and median take-home would be significantly less, but I was surprised at the outcome. 2008 YTD average is $168.54 and 2008 YTD median is $170. Both figures are surprisingly close to my all-time average.
*I do not subtract money spent on food during my shifts. This is important so that my variable food spending (which can range from $0 to $20 during a shift) doesn’t affect the outcome and so that I don’t have an odd monetary incentive to not eat (in order to inflate my take-home pay statistics). But, the reality for most drivers is that ‘food costs’ are a real expense, subtracted from take-home cash pay. So, any other cab drivers reading this, be sure to add back in your food costs to compare your earnings to mine.

Great earnings report. I’m finding 2008 is well shy of 2007 income levels. My overall average since April ’07 is $207. My 2007 average was $236. My 2008 average is $172. Even with an extra, say, $30 in gas each night, I’m still off about 15 percent from last year. I had a few very low shifts (including a negative $16) which has dragged down the average, but my earnings are well off from the same period last year.
Good luck!
Just curious (1) how much daily rent you pay for your cab (2), how many average miles you drive daily and (3) what your average gasoline prices are.
So great that you wrote this data down. It would be cool to run it against temperature data (ex holidays/ special days / outliers).
My theory is that the DIFFS [http://isomorphismes.tumblr.com/post/47153142755/subtraction] in daily temperature would positively correlate with more activity. I.e. once it’s already summer warmth doesn’t make people come out. But warm after a cold spell does. (And cold during warmth makes people stay in.)
But I could just be conflating a few happenstances during spring with a too general pattern.