- San Francisco 1900: Average speed of public transit 8.0 mph*
- San Francisco 2007: Average speed of public transit 8.1 mph (SF Gate)
What went wrong in the past 107 years? How has the San Francisco City and County increased average transit speeds by only 0.1 mph in a century?
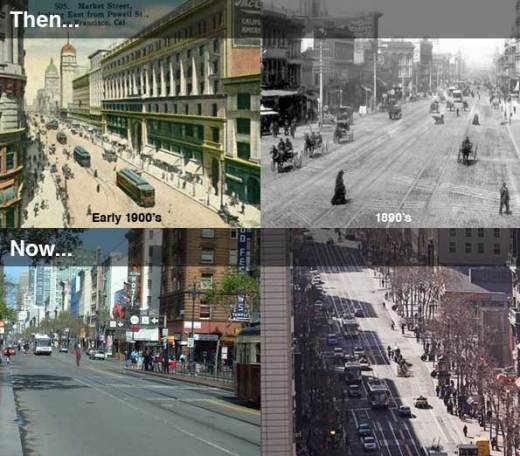
The photo comparison above shows a central travel corridor in the City, Market Street. It appears to have seen very little progression aside from the addition of significant individual motor vehicle traffic. Streetcars have been replaced by trolley buses. Pedestrian crossings seem to be a bit more organized now, although jaywalking is still prevalent, especially near 5th and Market.
Of course, what’s under Market Street has changed. BART is an undisputed success. As much as the MUNI metro lines suck, they do move at a reasonable rate (along the Market Street corridor) when there are no major disruptions in service.
So, why have our surface streets suffered from a lack of planning insight in 100 years? Why are cars given a free pass to rule our City?
I don’t know. Anyone?
*Max cable car speed 8.5 mph. I subtracted 0.5 mph for dwell (passenger boarding or disembarking) time. However, I figure very little, if any, dwell time actually occurred since there was no risk of liability claims from cable car injuries back then. People simply boarded whenever they pleased, even if the vehicle was in motion. (Check out this video about 10 seconds in. People board the car even as it’s on the turntable!)

Pingback: Oh, 1905. I miss you. « blog
Pingback: SF Muni, slowness of // Steve Cochrane
Pingback: 1 mile on the MUNI takes longer than 10 on BART. « blog